The Nebular Properties of Star-forming Galaxies at Intermediate Redshift from the Large Early Galaxy Astrophysics Census
The Nebular Properties of Star-forming Galaxies at Intermediate Redshift from the Large Early Galaxy Astrophysics Census
Jul 27, 2022· ,,,,
,,,,
Jakob M. Helton
Allison L. Strom
Jenny E. Greene
Rachel Bezanson
Rachael Beaton
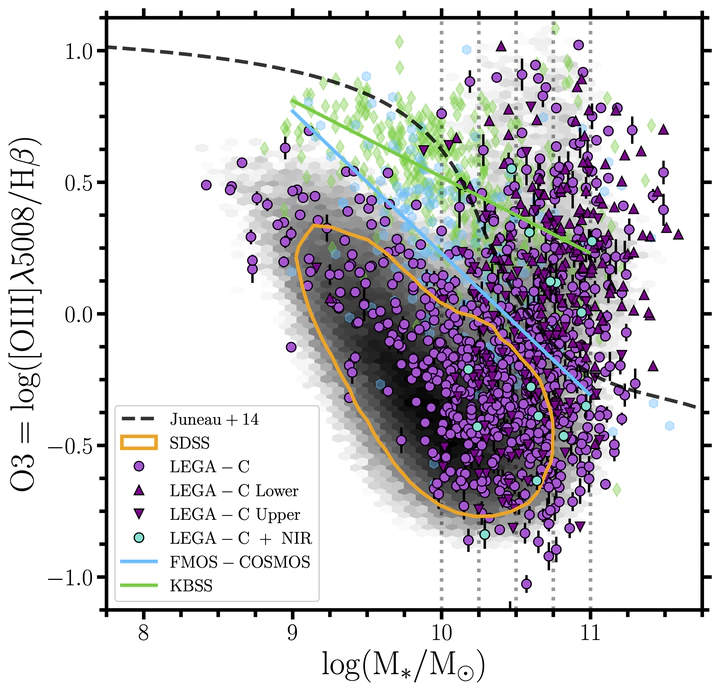
 Figure 4 from Helton et al. (2022, ApJ, 934, 81).
Abstract
We present a detailed study of the partial rest-optical ($\lambda_{\mathrm{obs}} \approx 3600-5600\ \mathrm{\AA}$
) spectra of $N = 767$
star-forming galaxies at $0.6 < z < 1.0$
from the Large Early Galaxy Astrophysics Census (LEGA-C). We compare this sample with low-redshift ($z \sim 0$
) galaxies from the Sloan Digital Sky Survey (SDSS), intermediate-redshift ($z \sim 1.6$
) galaxies from the Fiber Multi-Object Spectrograph (FMOS)-COSMOS Survey, and high-redshift ($z \sim 2$
) galaxies from the Keck Baryonic Structure Survey (KBSS). At a look-back time of $6-8\ \mathrm{Gyr}$
, galaxies with stellar masses $\mathrm{log}_{10}(M_{\ast}/M_{\odot}) > 10.50$
appear remarkably similar to $z \sim 0$
galaxies in terms of their nebular excitation, as measured using $\mathrm{[OIII]}\lambda5008/\mathrm{H}\beta$
. There is some evidence that $0.6 < z < 1.0$
galaxies with lower $M_{\ast}$
have higher $\mathrm{[OIII]}\lambda5008/\mathrm{H}\beta$
than $z \sim 0$
galaxies and are more similar to less evolved $z \sim 1.6$
and $z \sim 2$
galaxies, which are offset from the $z \sim 0$
locus at all $M_{\ast}$
. We explore the impact of selection effects, contributions from active galactic nuclei, and variations in physical conditions (ionization parameter and gas-phase oxygen abundance) on the apparent distribution of $\mathrm{[OIII]}\lambda5008/\mathrm{H}\beta$
and find somewhat higher ionization in $0.6 < z < 1.0$
galaxies with lower $M_{\ast}$
relative to $z \sim 0$
galaxies. We use new near-infrared spectroscopic observations of a subsample of LEGA-C galaxies to investigate other probes of enrichment and excitation. Our analysis demonstrates the importance of obtaining complete rest-optical spectra of galaxies in order to disentangle these effects.
Type
Publication
The Astrophysical Journal, Volume 934, Issue 1, id.81, 18 pages